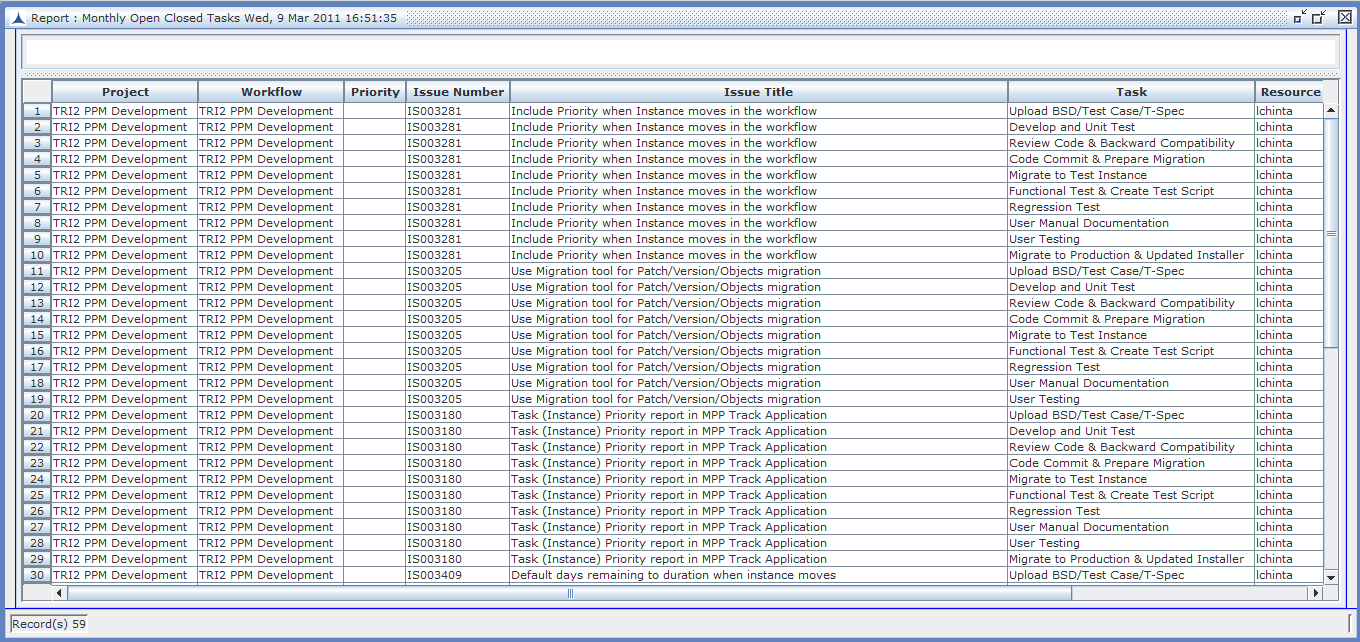
Task Open Closed Summary Report shows project data (No. of tasks opened and closed on a particular date) in different time period like DAILY, WEEKLY and MONTHLY.
Navigation: Issue Management -> Reports -> Task Open Closed Summary
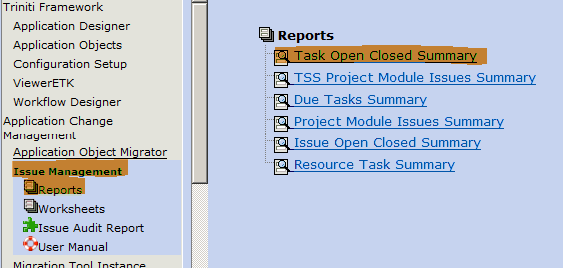
Figure: Reports
Click on "Task Open Closed Summary" opens Task Open Closed Summary report with Query dialog
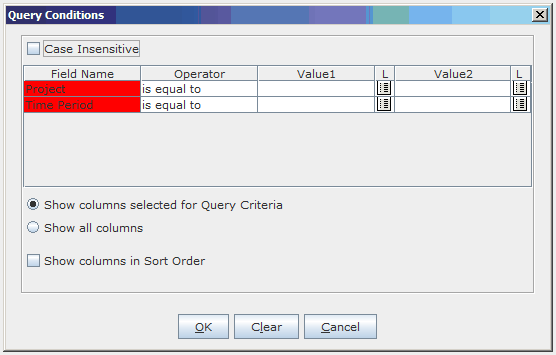
Figure: Task Open Closed Summary
Fill Project and Time Period values for the required project and then click on OK button to get the data
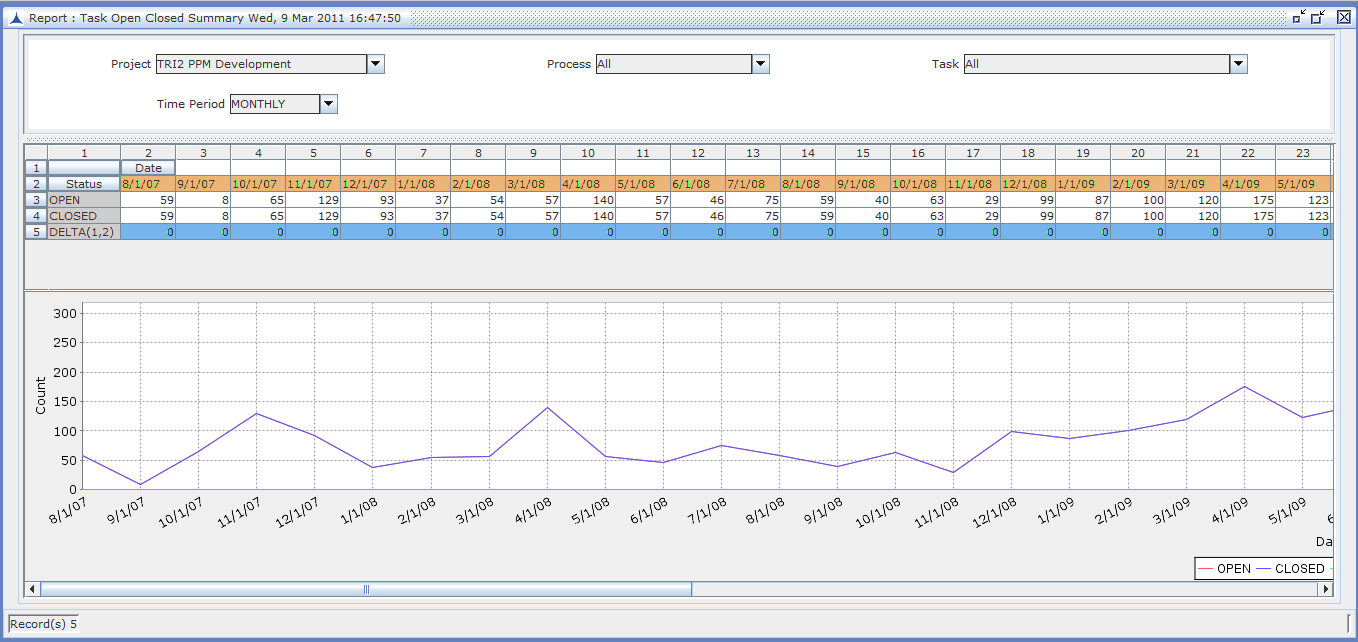
The report shows data on the top portion and graph in the bottom portion. Date values are shown as Row Header and Status (OPEN, CLOSED, DELTA = OPEN-CLOSED) values are shown as Column Header. Each value in the cell represents the no. of Tasks on the status and the date.
Red line in the graph indicates OPEN Issues, Blue line indicates CLOSED Issues and Green line indicates DELTA.
Data can be refreshed for different time periods by selecting another time period value from the "Time Period" drop down list in the filter area and click on the refresh button, which blinks automatically after changing the Time Period value.
Select another time period from the Time Period drop down list:
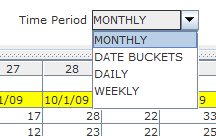
Click on Refresh button, which blinks automatically after Time period value is selected in the drop down list:
![]()
Now data will be refreshed for selected Time Period for the same project.
Right click on any data cell pops up a menu for drilling down to respective time period Open Closed Tasks
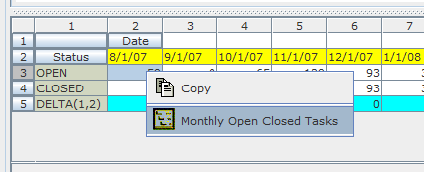
Click on Drill down report to show the list of tasks for the selected status and date (MONTH/WEEKLY/DAILY)
